See where Bitcoin whales bought
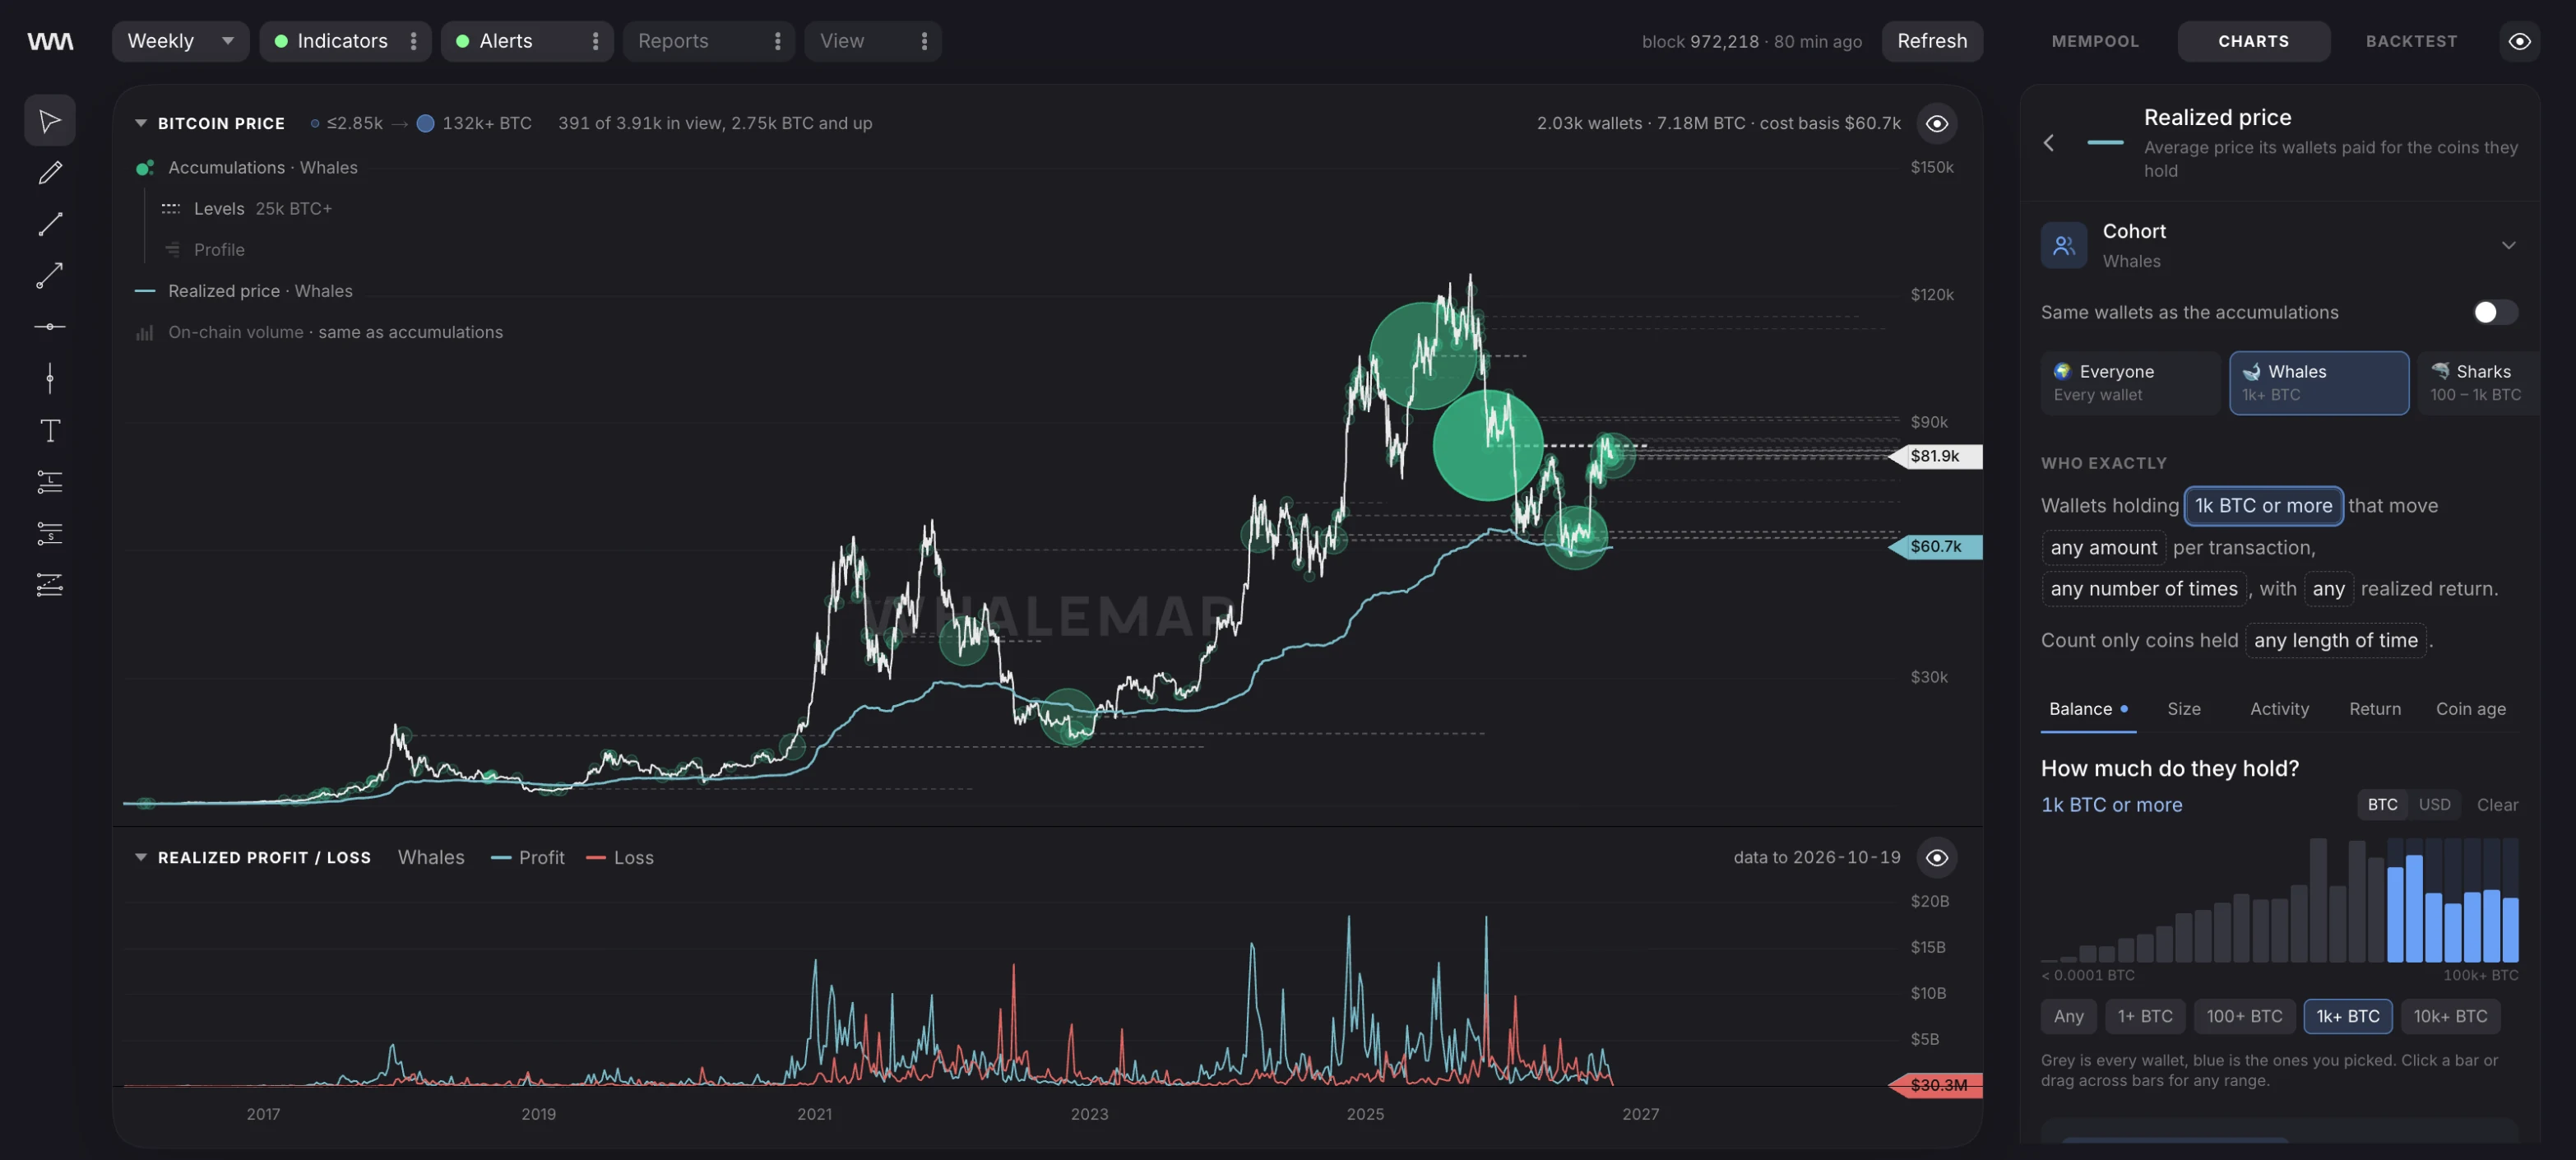
Whalemap plots the coins big wallets still hold at the price they paid, and the average cost of everything they own. Stop guessing where the big money sits.

Whalemap plots the coins big wallets still hold at the price they paid, and the average cost of everything they own. Stop guessing where the big money sits.


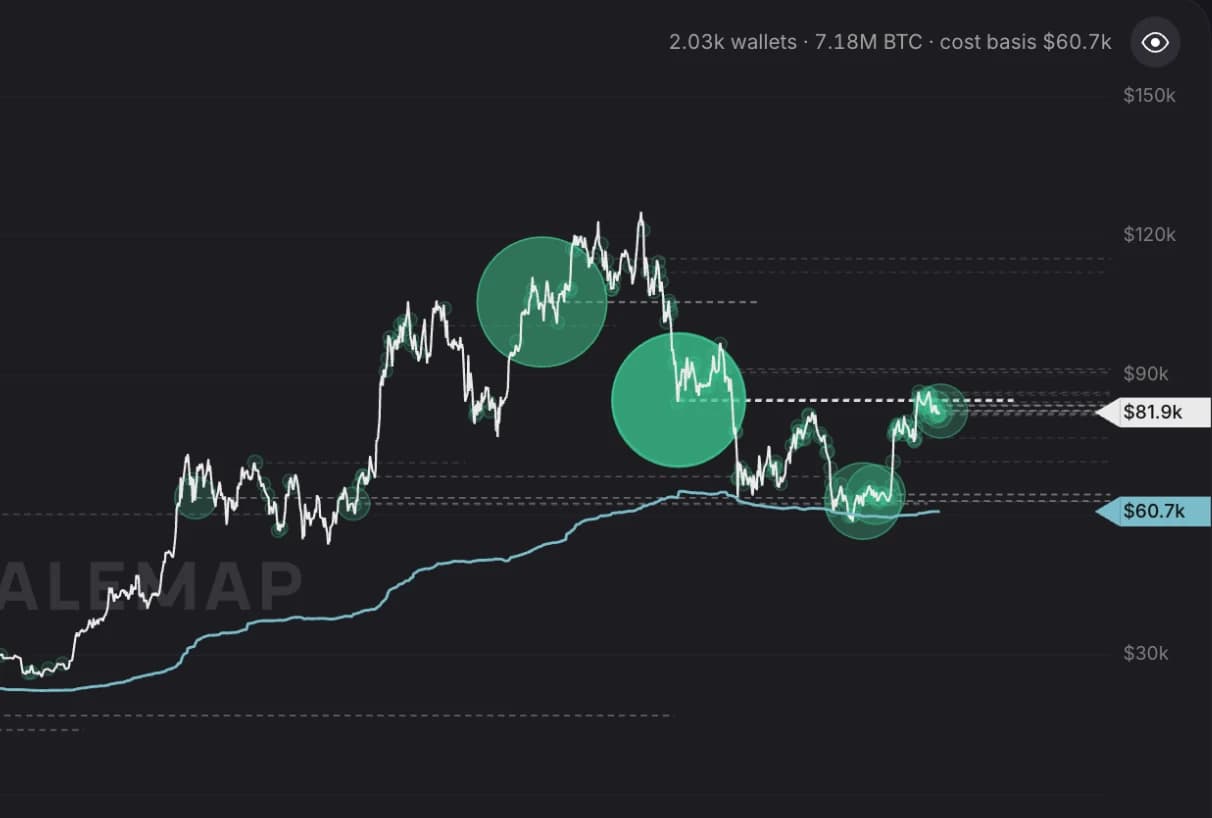
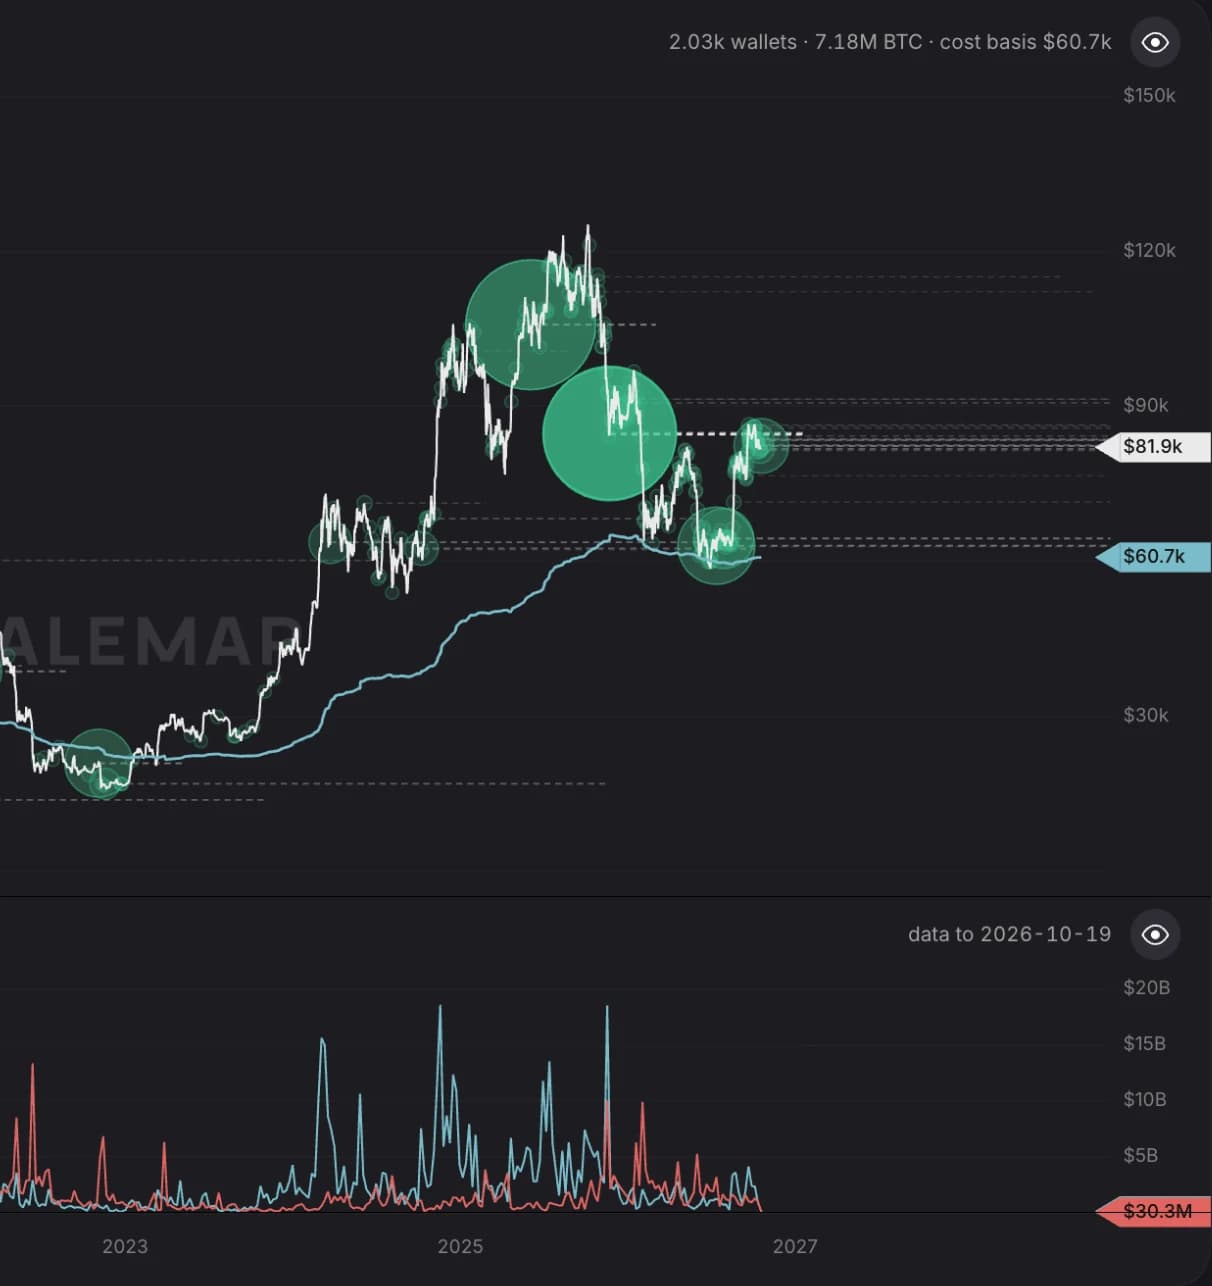
Accumulations. A bubble is the BTC a cohort received on one day and still holds, drawn at that day's price. Bigger bubble, more coins.
One stack of charts. Price, accumulations, realized price and profit/loss share a time axis, so a move in one lines up with the rest.
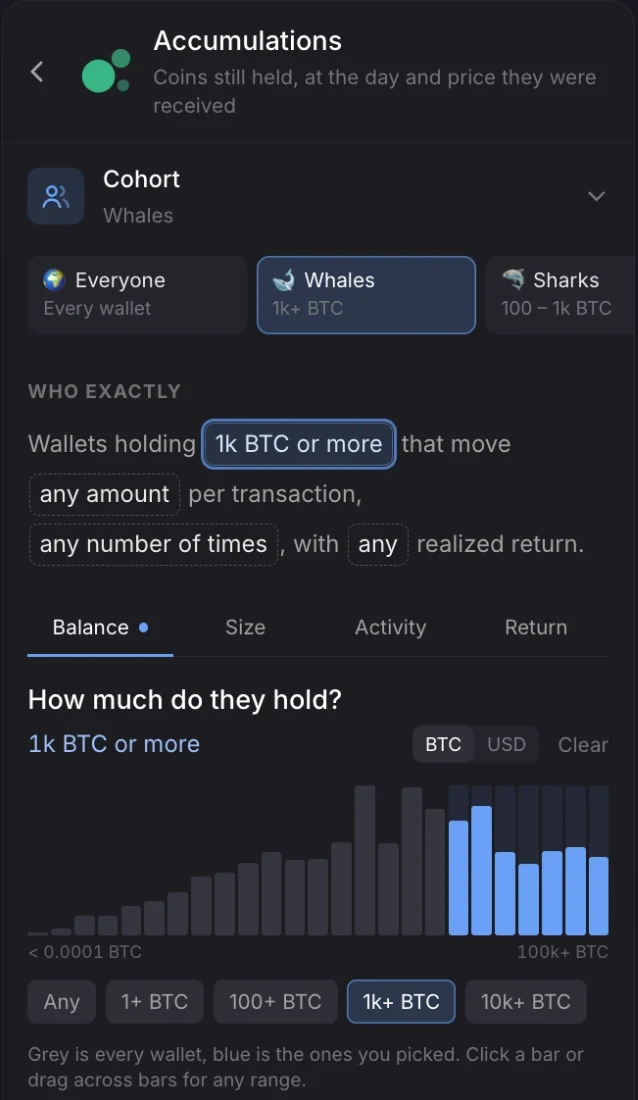
Pick the wallets. Start from Whales, Sharks or Dormant whales, then narrow by balance, transaction size, activity and realized return. Then apply that cohort to any chart in the stack.

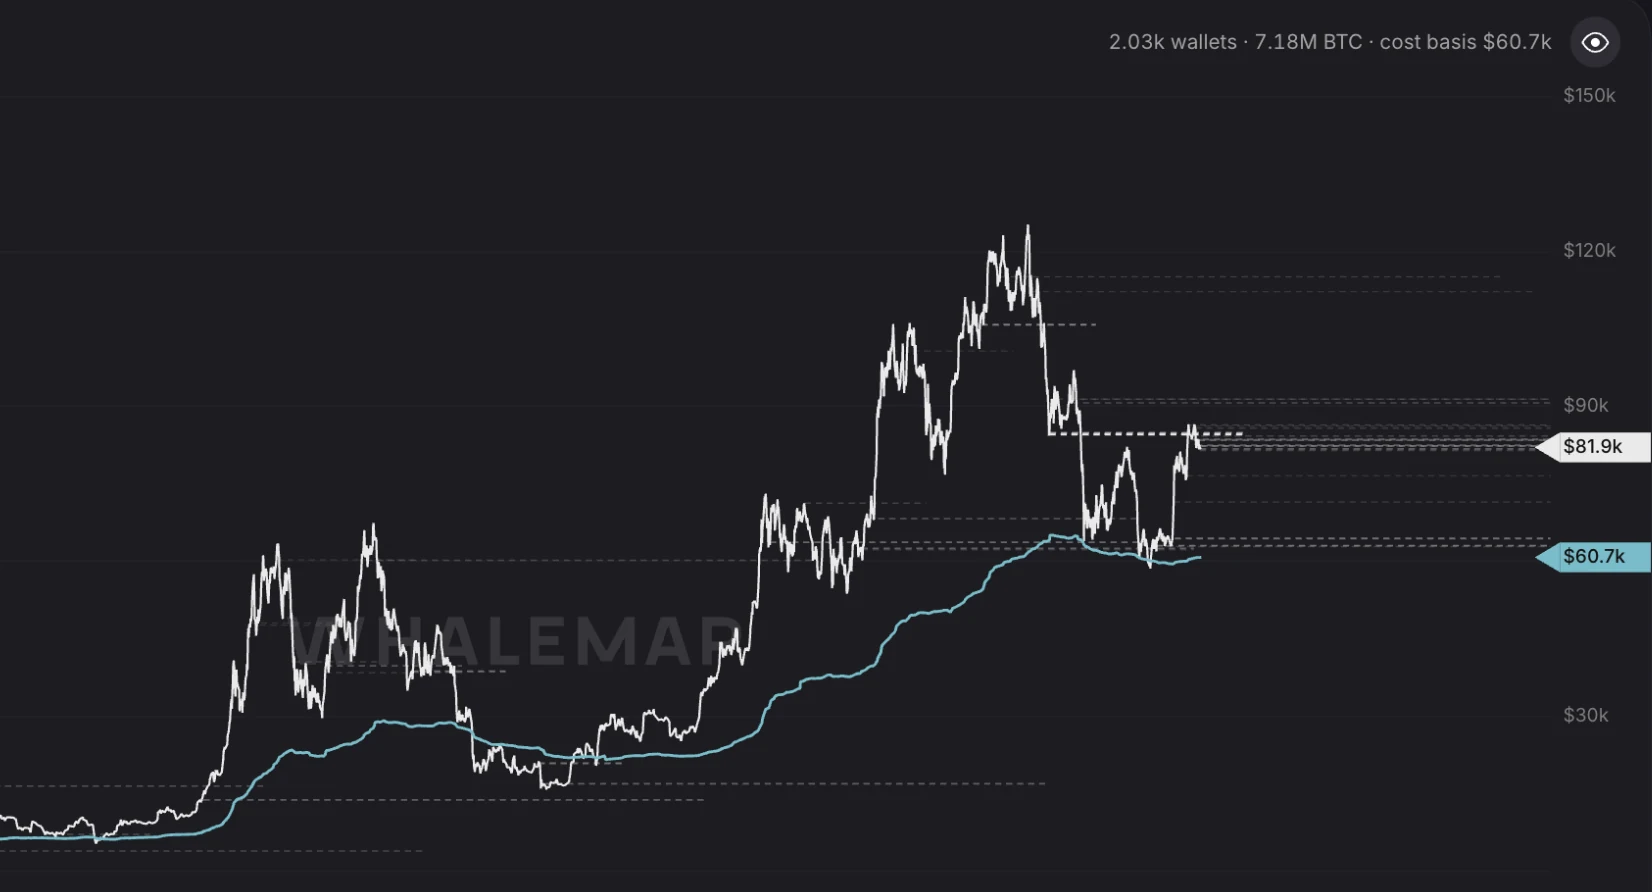
Know their cost basis. The realized price is what a cohort paid, on average, for the coins it holds now. On 20 October 2026 whales were at $60.7k with Bitcoin at $81.9k.

See who sold, and whether it paid. Realized profit and loss compares what spent coins sold for with what they cost. Spikes show a cohort cashing out, or giving up at a loss.

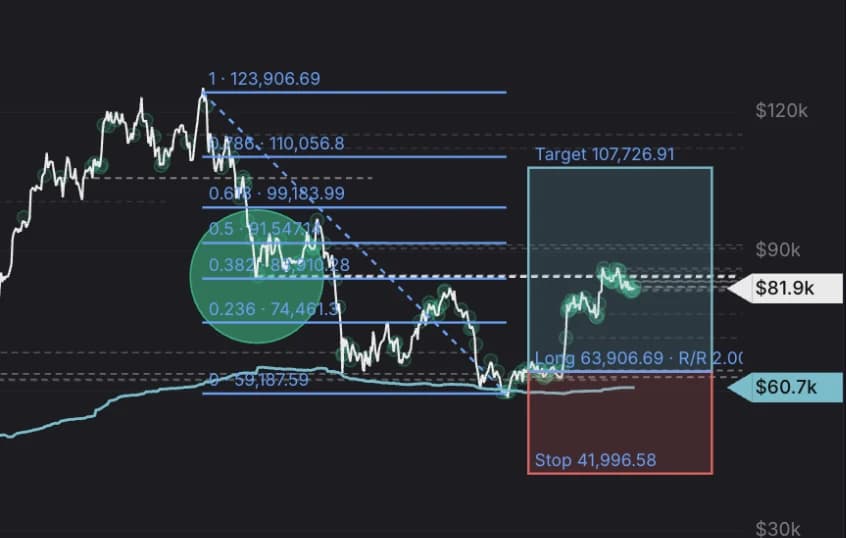
Mark up your levels. Draw on the same chart as the whale data. Plan an entry against their cost basis and see the reward and risk before you trade.

Tracking Bitcoin whales since 2020. Cointelegraph, Forbes and CoinDesk have run our charts.
Our engine reads every block from a Bitcoin Core node into ClickHouse. Each coin keeps the price it was created at and the price it was spent at, so cost basis, profit and loss come straight from the chain.
Every block. History goes back to the genesis block in January 2009.
Within the hour. Cohort data trails the newest block by an hour at most, and the terminal shows its age.
USD, applicable tax included. The trial starts on your first signed-in visit. Subscriptions renew automatically; cancel in billing settings and keep access until the end of the paid period.